Key Takeaways
- 52% of American adults have life insurance coverage in 2023.
- 41% of adults feel they don’t have enough life insurance.
- After the pandemic, interest in life insurance is at an all-time high, with 39% of consumers intending to buy life insurance in the next year.
- The parents of young children are more likely to own life insurance than the general population (59% versus 52%).
According to a recent study, the top reason respondents reported not having purchased life insurance was due to a lack of understanding about how much or what type of coverage was needed.
Life insurance can be the safety net that keeps your household financially secure amidst the loss of a primary wage earner. After a life-changing global pandemic, interest in life insurance has hit a record level. According to a recent study by the Life Insurance Marketing and Research Association (LIMRA), a record-breaking 39% of Americans expect to buy life insurance within the next year.
However, straitened economic circumstances have prevented many from purchasing the coverage they need.
Read important 2023 life insurance statistics below to help you understand industry trends and which demographics are buying life insurance – and why.
U.S. Life Insurance Ownership Overview
Though it’s common to own a life insurance policy, there is still a large gap between those who are covered and those who aren’t. Part of the reason is that many Americans can’t afford it. Households with a lower income are less likely to buy a life insurance policy.
One consideration is that if your income is lower, the required amount of life insurance may also be lower. Often, the amount of income is a direct factor in the recommended insurance coverage suggested by an advisor.
- About 52% of Americans own life insurance as of 2023.
- 41% of adults – both insured and uninsured – feel they do not have an adequate amount of life insurance.
- Among the uninsured, the top reason for not purchasing life insurance was being unsure of what type and amount of coverage to buy.
Relationship status is another factor that contributes to life insurance ownership. Since 1980, the number of single-mother households has grown by 40% in the U.S. In 2023, 59% of single mothers recognize that they need insurance coverage or don’t have enough.
According to Eric Estevez, “The budgetary constraints of a policy are an issue in a single-mother household. That being said, a broker with access to multiple companies may be able to find affordable coverage.”

Life Insurance Coverage You Can Count On
*We may be compensated if you click this ad.
How Many People Have Life Insurance Policies?
A little more than half of American adults own a life insurance policy in 2023. Age has a significant influence on who is likely to be insured. Younger adults are less likely to have life insurance coverage, but LIMRA’s 2023 Insurance Barometer study reported a higher-than-typical rate of interest among younger respondents.
- 50% of Millennials plan to purchase life insurance coverage within the year.
- Even among the youngest group, Gen Z (adults up to age 26), 44% reported the intent to buy life insurance by 2024.
While older adults are more likely to own life insurance, their ownership rates have been on the decline. In fact, adults within the Gen Z and Millennial group (adults up to the age of 40 years old) show the most interest in buying or increasing life insurance coverage in the next year.
In my experience as an agent, I observe that a lack of financial education has been a reason for not considering life insurance in the past. Many clients approach me after the loss of a loved one, sickness of a spouse or another life event that sparks their interest. The role of a good advisor can assist them in determining the coverage they need within the desired budget of the potential client.
Life Insurance Facts by Gender
Gender gaps are another large determining factor in life insurance ownership. While more women report needing life insurance, more men own a policy. Women generally have lower wages than men, live longer and spend more years providing unpaid familial care, all of which may contribute to their lower rate of coverage.
- According to LIMRA, 53% of American men own life insurance compared to less than half (46%) of women. This data marks the sixth year in a row of a decrease in women’s life insurance ownership.
- However, 72% of women report needing life insurance compared to 60% of men.
- 59% of single mothers report needing life insurance, or more of it.
- 60% of women with life insurance feel financially secure.
- 58% of women without life insurance report feeling financially insecure.
- Just 26% of men in the U.S. reported feeling a high level of stress concerning their household finances, compared to almost 37% of women.
- 52% of men and 65% of women both reported burial and final expenses as a major reason to own life insurance.
Life insurance tends to cost less for women than for men, but their reasons for buying are similar. Both groups cited burial and final expenses as their top reasons to own life insurance, second to replacing lost wages.

Life Insurance Coverage You Can Count On
*We may be compensated if you click this ad.
Life Insurance Statistics by Generation
In the recent LIMRA study, data shows younger generations are less likely to currently have coverage and more likely to have a life insurance gap.
- 40% of Gen Z adults own life insurance. 44% have indicated the intent to buy life insurance within the year.
- 48% of Millennial Americans own life insurance. 50% have said they plan to purchase life insurance within the year.
Older, more financially secure adults are more likely to own life insurance policies. However, the younger generations have shown dramatically increased interest in owning life insurance, possibly due to the hardships of the pandemic.
While 56% of Black Americans own life insurance (which is more than any other race) there is still a significant gap in coverage, with 75% of Black Americans reporting a need for life insurance.
The Relationship of Financial Security and Life Insurance
There’s a positive correlation between life insurance ownership and financial security. When comparing life insurance owners with non-owners, the former are 68% more likely to feel financially secure.
- 68% of people with life insurance feel financially secure, while only 47% of non-owners feel the same way.
- More than half of American consumers report they aren’t covered because life insurance is too expensive.
- 78% of life insurance owners with both worksite and individual coverage feel financially secure.
Life insurance provides financial security by ensuring households are prepared for the death of a primary wage earner. As it is, a majority of Americans report they’d feel the financial strain within a week to six months of such an event.
Read More: How To Get Affordable Life Insurance
Why Do People Buy Life Insurance?
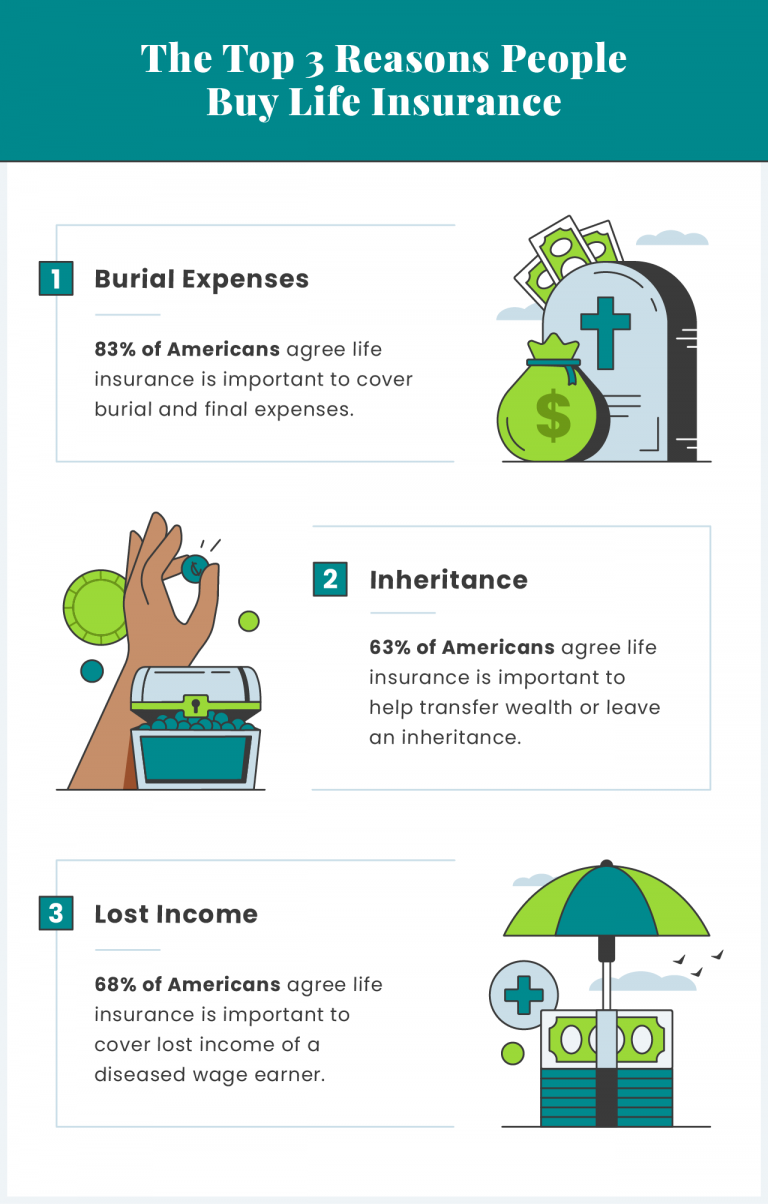
According to a recent report from LIMRA, the top three reasons people buy life insurance are to cover burial expenses; to compensate for the income of a diseased wage earner; and to transfer wealth or leave an inheritance for their beneficiaries.

- 83% of Americans consider covering burial and final expenses as important reasons to buy life insurance.
- 68% of Americans consider covering the income of a deceased wage earner as an important reason to buy life insurance.
- 63% of Americans consider it important to buy life insurance to help transfer wealth or leave an inheritance.
- 60% of Americans without life insurance say the cost is the major reason they aren’t covered.
- 55% of Americans report their other financial priorities prevent them from buying life insurance.
- 53% of consumers are unsure what type of life insurance they should get.
Some of the most common reasons people don’t buy life insurance are because of the cost, the prevalence of other financial priorities or because they’re unsure of what type of policy to get.
Life Insurance Industry Trends
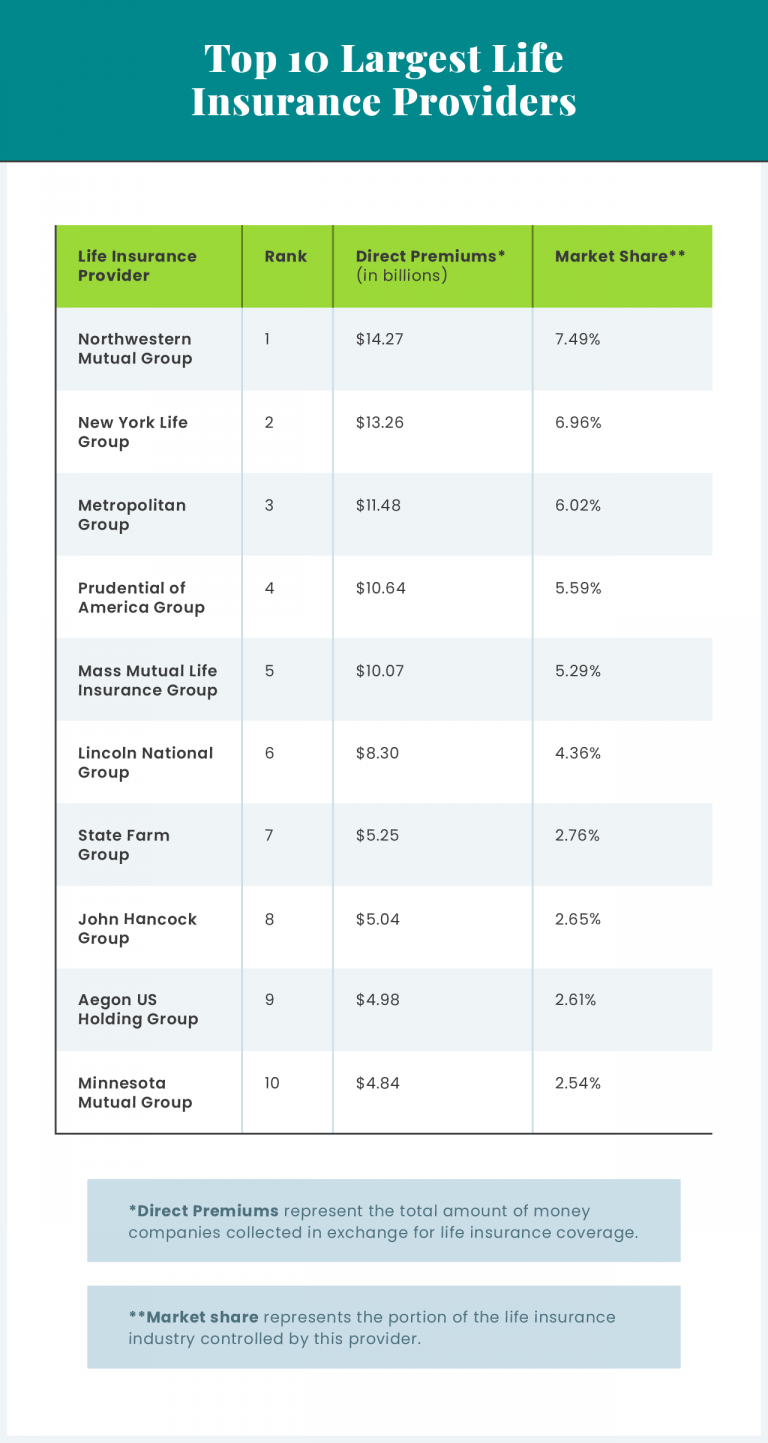
Of the total insurance providers that report to the National Association of Insurance Commissioners, the top 10 insurance providers are responsible for nearly half of all life insurance policies.

Source: NAIC
- The combined life insurance market share of the top 10 providers is over 46%.
- Annuity premiums are currently a larger share of income for most insurance companies.
- In 2022, direct life insurance premiums brought in over $193 billion.
- According to the NAIC, counting annuity premiums, accident and health premiums, and deposit-type contract funds, insurance companies brought in over $821.4 billion as of March 23, 2023.
- Northwestern Mutual Group is the life insurance provider with the largest industry market share at 7.2%.
Overall, business for life insurance has risen by $15.8 billion in 2022, due in part to a surge in annuity sales.

Interested in Learning More About Your Annuity Options?
How Much Does Life Insurance Pay Out?
Life insurance payouts rose significantly from 2020 to 2021 but saw a more moderate increase in 2022.
- Americans received $797.7 billion in total from all life insurance claims and benefits in 2022, which is an increase from $790.9 billion in 2021.
- The total amount of death benefits dropped from $97.2 billion in 2021, down to $88.8 billion in 2022.
- The amount collected from annuities also dropped slightly, from $92.2 billion in 2021 down to $89.7 billion in 2022.
- In 2022, the largest single payout category was surrender benefits and withdrawals with a total of $348.1 billion — which was still down from 2021’s high of $362.7 billion.
- The largest year-over-year increase came in the aggregate reserve, which rose from $80.9 billion in 2021 to $116.2 billion in 2022.
Finding the Right Coverage for You
If your household would find it financially difficult to deal with the death of its primary wage earner, life insurance is a great safety net. Whether you invest in a traditional policy or an annuity, there are options out there to ensure that you and your family are covered, no matter what.
If you’re interested in investing in an annuity or a life insurance policy, connect with a financial advisor to help answer your questions about the process.
Editor Malori Malone contributed to this article.


