

Investing has become more common among Americans with the disappearance of pension plans in the private sector and a greater reliance on retirement accounts. For most Americans, investing means putting their money into the stock market.
More than half of all Americans – 62% – had money invested in the stock market in 2024, according to Gallup. The most common way to own stock is through a retirement plan such as an individual retirement account or 401(k), according to the Pew Research Center.
Stocks are the most common type of investing as well as one of the simplest types in the U.S. But they are just one type of investment.
What Is Investing and How Does It Work?
Investing is a strategic approach to growing your wealth over time by purchasing financial assets, such as stocks, bonds or exchange-traded funds, with the goal of generating returns. Investing works by purchasing financial assets that have the potential to grow in value, while managing risk and adhering to a long-term investment plan.
Saving and investing have several differences. Saving typically means you put money away for current or short-term needs such as an emergency fund or a large purchase. Savings are usually easy to dip into when you need the money. Investing requires a long-term commitment and is designed to make your money return a sizable profit.
Investing for beginners works in two ways appreciation and income generation.
Appreciation involves buying stocks or other investments when their price is low and selling them when their price is higher. The value of the investment appreciates over time.
You can also make money by holding on to investments that generate profits. This can happen when stocks you invest in pay dividends.
What Are the Most Common Types of Investments?
There are four common types of investments: stocks, bonds, commodities and real estate.
In addition, there are mutual funds and ETFs. These let you buy a mixture of different types of investments. If you have a retirement account, you are probably invested in a mutual fund.
- Stocks
- Companies sell shares of stock to the public to raise money for their operations. Buying stock means you own a piece of the company. If the company is profitable, your stock will increase in value – and in some cases you may be paid a dividend. If the company is unsuccessful, you can lose money as your stock drops in value. The point at which a company goes public is called the initial public offering period. Occasionally, a special purpose acquisition company may be used to take a private company public.
- Bonds
- Governments, municipalities and corporations sell bonds to raise money. If you buy a bond, you make a loan to the issuer you bought it from. You will receive an interest payment over a fixed period. Bonds tend to be less risky than stocks, but the return may be lower.
- Commodities
- Commodities include agricultural products, oil, gas and other energy products and metals – including precious metals such as gold and silver. Their value fluctuates based on market demand. For example, if there is a shortage of oil, the price of oil will increase and your investment will rise in value.
- Real estate
- Buying your home or a piece of land can be an investment in real estate – if you expect the value to increase over time. Risk varies for real estate investments. Property values can be affected by everything from crime rates in a neighborhood to something as large as the housing market collapse that led to the Great Recession. You can also buy shares in a real estate investment trust, which is a company that uses real estate to generate income for shareholders.
- Mutual funds and EFTs
- Mutual funds and ETFs let you buy different combinations of common investments such as stocks, bonds, commodities and real estate. Investing in these funds means that you are investing in hundreds of different assets. This can diversify your portfolio and mitigate risk of losing money on your investments.
Most Common Investment Types
Read More: What Is a Certificate of Deposit?
More Advanced and Alternative Investments
There are several other alternative and advanced investments. They often involve high risk or may require a lot of money up front to invest.
Alternatives to the most common investment types include private equity funds, hedge funds and cryptocurrency.
- Private equity
- Private equity allows companies to raise cash without going public. Private equity funds and other investors put their money into private companies or buyout public companies.
- Derivatives
- Derivatives tend to be high risk and high reward investments. They are financial instruments that derive their value from another financial product – such as a market index, which includes the S&P 500, the Dow Jones, the Nasdaq and the Russell 2000.
- Options
- Options are a type of derivative. Options give the buyer the right to buy or sell a security for a fixed amount within a certain period.
- Hedge funds
- Hedge funds require a large minimum investments or a high net worth. You have to be wealthy to buy in. Hedge fund investors pool their money and often make high risk investments. Strategies include buying investments with borrowed money in hopes of turning a large profit.
- Cryptocurrency
- Cryptocurrencies are digital currencies that are not backed by any real assets. Bitcoin is probably the most famous example. Cryptocurrencies can be traded without brokers and tracked on digital ledgers. Most risks with this type of investment are related to the volatility of cryptocurrencies, which causes their value to swing wildly at times.
Advanced and Alternative Investment Types
Unlike bank accounts, investments are not guaranteed or insured by the Federal Deposit Insurance Corp. or any other government agency. This is true even if you buy a mutual fund or other investment product through a bank. You assume the risk of losing money when you choose to invest.

Why Is Investing Important?
From a personal finance standpoint, investing is important because it can ensure your financial security in the present and in the future. Investing can let you grow your wealth faster than the rate of inflation.
You can also benefit from compound interest or growth of your investment’s value. And investing may give you tax advantages.
Investing can also provide greater financial security in retirement or provide a path for you to retire earlier than you thought possible. And it can help you meet other financial goals such as buying a home or sending your kids to college along the way.
Read More: Investing for Beginners
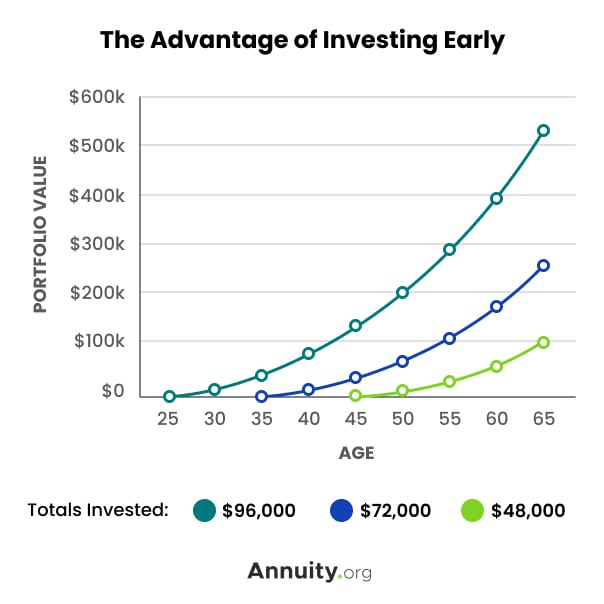
When is the Best Time To Start Investing?
The earlier you start investing, the greater your potential profits will be. This is the result of putting more money into your investments over a longer period and the power of compound wealth over time.
Investing requires you to get your financial house in order so you can free up money. Creating an annual budget, managing your spending and limiting debt are essential first steps. These are all part of ensuring your financial wellness to take the next steps toward investing.
- Create an emergency fund
- Put aside savings to handle any unexpected emergencies. The rule of thumb is that an emergency fund should be equal to three months of your expenses.
- Have money at the end of each month
- When you cover all your expenses and still have disposable income at the end of the month, it is a sign you may be able to invest the surplus cash.
- Commit to long-term financial goals
- Investing requires a long-term commitment. It means routinely putting money into your investments to grow your wealth. This is a financial and psychological commitment. Make sure you are ready.
- Access to a retirement account
- For most Americans, a 401(k), 403(b) or IRA is the simplest investment route. Enroll in your employer’s retirement plan if one is offered. If not, talk with your bank or a financial advisor about IRAs or other retirement plan options that may be available to you.
Four Steps To Take Before Investing
Let’s Talk About Your Financial Goals.
How To Start Investing
When you are ready to start investing, create a strategy. Determine the amount of money you can invest, the amount of risk you feel comfortable with and then set a timeline to reach your financial goals.
Roadmap on How to Start Investing
- Understand your investment options: stocks, bonds, mutual funds and more
- Open an investment account: a 401(k) through your employer or an IRA through a bank, for example
- Choose your investment strategy: based on your goals, risk tolerance and timeline
There are several types of investment options you can start with.
If you have limited money to open an account, you may want to consider a robo-advisor. These automated investing platforms let you customize your investments based on your risk tolerance and goals.
An online brokerage account can give you greater hands-on control over your research and investment choices.
Talking to a licensed financial advisor can let you start investing with a more hands-off approach with a trusted advisor who understands your goals and has the professional expertise to manage your investments.
What Are the Most Popular Investing Styles?
The most popular investing styles are active and passive.
Passive investing is less hands-on, meaning you don’t have to closely monitor or manage your investments as frequently. It involves taking your time and letting the market run its course naturally.
Active investing is more hands-on, requiring you to be more active in managing your investments. You make decisions about your investments before changes in the market. This requires research and keeping a close eye on forces that may change the market.
Both styles have advantages and disadvantages. The best style is the one that fits your level of commitment to managing your investments, your risk tolerance and which you feel more comfortable with.
Common Financial Terms Used in Investing
The world of investing often seems like it has a language of its own. These are a few key terms you should know when you are researching investments or thinking about your first investments.
- Bond
- Bonds are similar to an IOU from a company or country. When you buy a bond, the issuer promises to pay you a fixed amount of interest over a specified period of time.
- Capital gain or loss
- The difference between the price for which you buy an investment and the price for which you sell it.
- Certificate of deposit
- A type of mid- to short-term savings account that holds a fixed amount of money for a fixed period of time – such as six months or a year. It typically pays a higher interest rate than a savings account.
- Compound interest
- Interest paid on top of interest you earn for your savings or investment. This has the effect of increasing your money’s value on a curve.
- Diversification
- Balancing risk by investing in a variety of securities such as stocks, bonds and commodities. The practice tends to minimize your risk.
- Dividends
- A portion of a company’s profit paid to shareholders.
- 401(k) plan
- An employer-sponsored retirement plan that lets workers divert part of their pay into retirement investments. The money is tax-deferred until you withdraw it. Employers may match part of your contributions.
- Individual retirement account (IRA)
- A tax-favored retirement plan. Contributions may be tax-deductible, tax-deferred or tax-exempt depending on the type of IRA and your income level.
- Money market fund
- A type of mutual fund with typically low risks. Money market funds invest in high quality, short-term corporate or government debt and pay shareholders based on interest.
- Mutual fund
- Mutual funds continuously pool money from many investors and invest it into a wide selection of stocks, bonds and other financial instruments.
- Risk tolerance
- The degree to which you are willing to lose some or all of your original investment for the chance of a higher return.
- Portfolio
- The combined holdings of all an individual’s different investments.
- Security
- Any investment instrument such as a stock or bond
- Stocks
- A financial instrument that signifies a fraction of ownership in a company and provides the owner with a proportional claim on a share of a company’s assets and profits.
14 Financial Terms To Know Before Investing
Source: U.S. Securities and Exchange Commission
You can find the definitions of more financial terms in the Annuity.org Glossary of Financial Terms. Professional financial advisors can also help you understand financial terms and jargon in plain English if you seek their advice.