Today’s Best Annuity Rates
The table below highlights today’s best fixed annuity and MYGA rates, across common term lengths. These rates are updated regularly and sourced from top-rated providers.
| TERM | CARRIER | RATE | PRODUCT | AM BEST RATING |
|---|---|---|---|---|
| 1 Year | CL Life and Annuity Insurance Company | 7.50% | CL Tarrant Trail 6-Year | B++ |
| 2 Year | Mountain Life Insurance Company | 5.25% | Secure Summit | B+ |
| 3 Year | Mountain Life Insurance Company | 6.00% | Alpine Horizon | B+ |
| 4 Year | Mountain Life Insurance Company | 6.05% | Alpine Horizon | B+ |
| 5 Year | Atlantic Coast Life | 6.45% | Safe Harbor Bonus Guarantee | B |
| 6 Year | Atlantic Coast Life | 6.67% | Safe Harbor Bonus Guarantee | B |
| 7 Year | Atlantic Coast Life | 6.90% | Safe Harbor Bonus Guarantee | B |
| 8 Year | Mountain Life Insurance Company | 6.00% | Secure Summit | B+ |
| 9 Year | Talcott Financial Group | 5.50% | EverStead MYGA | A- |
| 10 Year | Atlantic Coast Life | 7.65% | Safe Harbor Bonus Guarantee | B |
- Rates rose across the board. Eight of ten terms improved and none fell, with the biggest jumps at the curve’s ends: 10-year (+1.85% to 7.65%) and 1-year (+1.50% to 7.50%). Only the 2- and 3-year held flat.
- The leaderboard turned over. Atlantic Coast Life now leads four terms; CL Life and Talcott are new at the top. Last week’s leaders — Global Atlantic, Americo, Wichita, Clear Spring — all dropped off.
- Higher yields, lower ratings. The new chart-toppers skew B/B++, versus several A/A- carriers last week — so the gains come with a credit-quality tradeoff worth flagging.
Fixed annuity rates show how much guaranteed interest you can earn over a set period. While they offer clarity and predictability, they may not provide the same long-term growth potential as fixed index annuities. The comparison below shows how fixed annuities stack up against indexed options.
Fixed vs Fixed Index Annuities
| If you care most about… | Fixed Index Annuity | Fixed Annuity |
|---|---|---|
| Guaranteed returns | No | Yes |
| Protection from losses | Yes | Yes |
| Growth potential | Higher potential | Limited |
| Predictability | Moderate | Very high |
| Simplicity | More complex | Simple |
Comparing Today’s Fixed Annuity Rates
Understanding fixed annuities, especially multi-year guaranteed annuities (MYGAs), can feel overwhelming.
These products lock in a guaranteed interest rate for a set period, typically three to 10 years. However, terms like surrender period, premium amounts and contract lengths can vary widely across providers.
Comparing terms side by side can help you better understand how locking in for a longer period may impact your guaranteed return. Use this chart to explore your options, identify competitive offers and take the next step toward securing reliable, low-risk retirement income.
Products displayed depend on your selected filters, including premium, term length and more.
Loading...
| Product |
Rate
|
Guarantee Period
|
Surrender Period
|
AM Best Rating
|
|---|---|---|---|---|
|
GCU Insurance 1 + 4 Choice |
3.90% | 1 Years | 5 Years | A- |

Access SPDA |
3.45% | 6 Years | 6 Years | A- |
|
Access SPDA |
3.25% | 4 Years | 4 Years | A- |
|
Security Benefit Life Insurance Company Advanced Choice |
4.80% | 3 Years | 3 Years | A- |
|
Security Benefit Life Insurance Company Advanced Choice |
5.15% | 5 Years | 5 Years | A- |
Consumers should determine how much they would like to invest in an annuity, then shop around to various highly rated insurance companies (look for at least an A- rating) to see what their rates are, and do comparison shopping, like you would when you buy a car.
Rubina K. Hossain, CFP®Client Advisor for MEIRACertified Financial Planner Rubina K. Hossain is chair of the CFP Board’s Council of Examinations and past president of the Financial Planning Association. She specializes in preparing and presenting sound holistic financial plans to ensure her clients achieve their goals.

MYGAs vs. Bonds and CDs
When deciding where to safely park your money, fixed annuities, certificates of deposit (CDs) and bonds are all worth considering. These options offer principal protection with predictable returns, appealing to conservative investors.
This is a look at the difference in rates based on the financial product.
| RATE TERM | HIGH-YIELD CD | U.S. TREASURY BOND | MYGA (ANNUITY) | TAX-EQUIVALENT YIELD OF MYGA* |
|---|---|---|---|---|
| 3 Years | 5.07% | 3.546% (3-Year Note) | 6.00% | 8.82% |
| 5 Years | 5.20% | 3.653% (5-Year Note) | 6.45% | 9.49% |
| 7 Years | N/A | 3.848% (7-Year Note) | 6.90% | 10.15% |
| 10 Years | N/A | 4.091% (10-Year Note) | 7.65% | 11.25% |
*Tax-equivalent yield assumes a 32% federal tax bracket for illustrative purposes. Annuities grow tax-deferred, giving them an advantage over taxable CDs and Treasuries for long-term growth
While they share some similarities, fixed annuities often provide higher rates than bonds and CDs, as well as tax-deferred growth, which can offer added benefits, depending on your financial goals.
- MYGAs: MYGAs often offer higher base rates and grow tax-deferred, making them ideal for long-term savers.
- CDs: Although FDIC-insured and predictable, CDs have earnings that are taxed annually, reducing real returns over time.
- Treasuries: Backed by the U.S. government, Treasuries are considered low-risk investments, but they still may underperform over longer durations.
Let's find the best options for you.
Which age range are you in? Your answer helps us show products and rates that fit your needs.
Loading Next Step...
Is Now the Right Time for a Fixed Annuity?
There are many reasons why right now may be the perfect time for a fixed annuity.
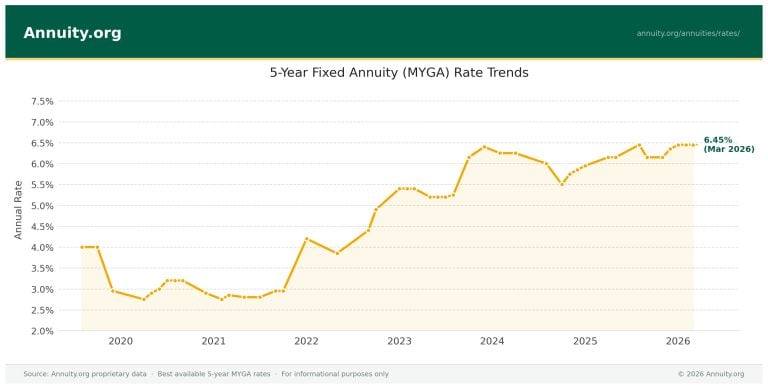
Fixed annuity rates are among the highest they have been in over a decade, fueled by recent federal rate hikes and strong bond market yields. If you lock in now, your rate won’t change if interest rates decline.
In 2024, there was also record sales of fixed annuities, with continued growth expected. This indicates that there is a strong investor sentiment. Also, in most cases, fixed annuities are outperforming bonds, offering stable income and principal protection.
If you plan to hold your annuity for a long time, it could be smart to lock in a higher rate now, instead of waiting. You can also choose specific terms, allowing you to secure today’s current rates while positioning yourself to potentially benefit from higher rates in the future.


- Historical Data.
- Expert Analysis.
- Instant Download.
Understanding Annuity Rates
Not all annuity rates are the same.
If you’re exploring annuities for the first time, it’s important to understand that your interest rate, payout rate and overall cash flow may all be different.
- Interest rate. The interest rate, also known as the declared rate or guaranteed rate, reflects how your money grows.
- Payout rate. The payout rate shows how much you withdraw annually compared to your premium.
- Cash flow rate. The cash flow rate expresses your annual income as a percentage of your original investment. However, it’s often mistaken for your true yield.
| Rate Type | What It Means | What You See | What You Get |
|---|---|---|---|
| Declared Interest Rate | Guaranteed growth for fixed terms (MYGAs, DIAs) | “5.50% 5-Year MYGA” | $5,500 growth on $100k over 1 year |
| Payout Rate* | The percentage of premium paid to you annually in income | “$6,800/year from a $100k annuity” | Equals 6.8%, not interest earned |
| Cash Flow Rate | Annual income divided by initial premium — includes return of principal | Same as payout rate in most cases | Includes both interest + principal |
Without a clear understanding of these differences, it’s easy to feel uncertain, delay a decision or end up with a product that doesn’t meet your expectations.
What Factors Affect Your Rate?
Annuity rates aren’t one-size-fits-all, so what you see advertised may not be the rate you ultimately receive. Your rate depends on a mix of personal factors, including your age and investment amount, as well as provider-driven factors, like market conditions and insurer policies.
Understanding what affects your rate helps you make more informed, confident decisions — and puts you in a better position to find the right annuity for your goals.
- Age
- Younger buyers may receive slightly lower MYGA rates because their money stays in the account longer, increasing the insurer’s liability.
- State of residence
- State-specific regulations affect product availability, insurer licensing and how contracts are regulated.
- Premium amount
- Larger premium contributions can unlock bonus rates or allow access to higher-tier products with better guarantees.
- Payout timeline
- Choosing to defer payouts for longer can result in a higher rate, especially for income annuities.
Personal Factors That Impact Your Annuity Rate
The variables above are tied to your unique profile, which is why quotes are often customized rather than guaranteed upfront.
For example, if you’re 60 and investing $100,000 in a 5-year fixed annuity, your quote might be slightly lower than a 55-year-old with the same amount because your payout window is closer and shorter.
- Interest rate environment
- When bond yields and Treasury rates go up, annuity rates tend to follow, but they may lag behind or fluctuate.
- Insurer strategy
- Conservative insurers often price more cautiously, while aggressive companies may offer higher (but riskier) rates.
- Financial strength ratings
- Highly-rated insurers (holding A or better ratings from AM Best) may offer slightly lower rates in exchange for long-term stability.
Insurer and Market Factors That Influence Offers
These factors exemplify the external forces that impact not only insurance companies but also the broader economic landscape.
For example, if Mary, a 62-year-old from California, invests $50,000 in a MYGA, her quoted rate may be lower than that of her friend in Texas who invests $100,000. This difference isn’t due to bias; it’s based on state regulations and the investment size.
Estimate What Rate You Could Qualify For
Annuity rates vary based on your unique profile, which includes factors like your age, investment amount and preferred income start date.
These sliders below can help you explore how each factor impacts your estimated rate. Once you have a solid idea of what to expect, take the next step to view your personalized quote from top-rated providers.
Estimate Your Fixed Annuity Rate
Estimated Fixed Annuity Rate:
6.00%
Frequently Asked Questions
As of April 2026, the best fixed annuity (MYGA) rates from A-rated carriers range from roughly 5.00% to 5.60%, depending on the term length. Higher rates are available from lower-rated insurers, but most financial professionals recommend prioritizing carriers rated A- or above for long-term guarantees. Current rates remain near 15-year highs, though they are expected to gradually decline as the Fed eases monetary policy.
Annuity rates are expected to edge lower through 2026 as interest rate cuts take effect, but the decline should be gradual. The 10-year Treasury is projected to settle in the mid-4% range through 2028, which means annuity rates should remain historically competitive even after modest decreases. For buyers considering a fixed annuity, locking in today’s rates may offer an advantage over waiting.
Fixed annuities currently outpace CDs by a meaningful margin. The best 5-year MYGA rate is approximately 6.30% compared to around 4.15% for a top 5-year CD. Annuities also offer tax-deferred growth, meaning you don’t owe taxes on interest until you withdraw, unlike CDs, which are taxed annually. The trade-off is less liquidity and potential early-withdrawal penalties if you’re under 59½.
A Multi-Year Guaranteed Annuity is a fixed annuity that locks in a guaranteed interest rate for a set number of years, typically three to ten. It works similarly to a CD but is issued by an insurance company and grows tax-deferred.
Yes. Some carriers are not licensed in all states and their products will not appear for your state. Use the state filter in the rates comparison tool to see products available where you live.
Look for an A- rating or better for strong financial stability. Carriers rated B++ or B may offer higher rates but carry more credit risk. The ratings are shown in the table for every product listed.
Still have questions?