
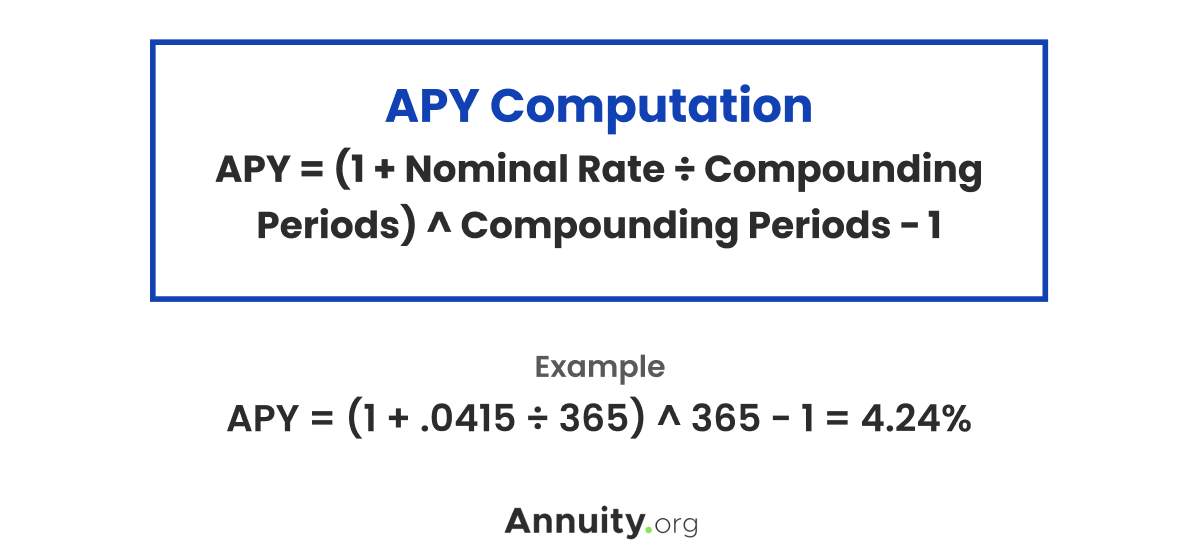
 The example above reflects the APY of a two-year CD, offering a nominal rate of 4.15%, compounded daily.
Bonds — Current Yield
For bonds, the metric of focus is the current yield. It is a measure of the annual coupon payments made by a bond relative to its current market price. The ratio indicates the amount of annual income you can expect to receive for every dollar invested.Did you know?
The current yield reflects the fundamental relationship between interest rates and bond prices. Generally, as interest rates rise, bond prices decline. Conversely, as interest rates fall, bond prices rise.
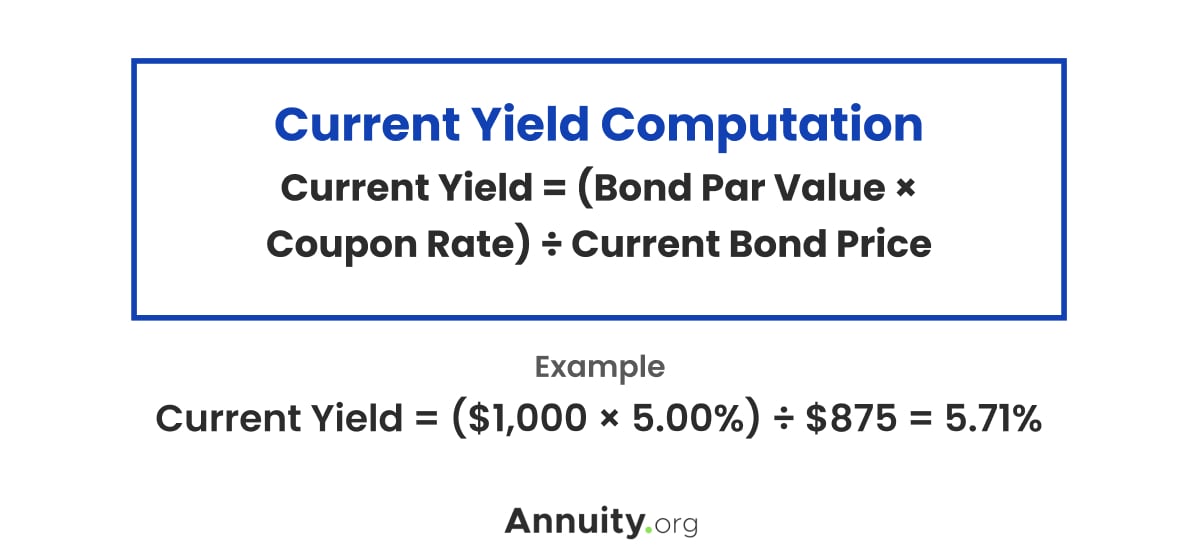 The example above reflects the current yield for a $1,000 par value bond that pays a 5.00% semiannual coupon and is currently trading at $875.
Note:
Another commonly used metric for bonds is the yield-to-maturity (YTM). It is the annualized rate of return that can be achieved by holding a bond until maturity. The YTM computation is more complex than the current yield computation, but its result is largely comparable.
The example above reflects the current yield for a $1,000 par value bond that pays a 5.00% semiannual coupon and is currently trading at $875.
Note:
Another commonly used metric for bonds is the yield-to-maturity (YTM). It is the annualized rate of return that can be achieved by holding a bond until maturity. The YTM computation is more complex than the current yield computation, but its result is largely comparable.
Stocks — Dividend Yield
For stocks and stock funds, the metric of focus is the dividend yield. It is a measure of the annual dividends paid by a company/fund relative to its current market price per share. The ratio provides an estimate of the amount of income you can expect to receive each year for every dollar invested in the stock. Generally, a company/fund pays dividends once per quarter, but the frequency can vary. Some pay a monthly dividend, some pay a semiannual dividend and some pay an annual dividend. Others pay no regular dividend at all. Regardless of frequency, the dividend payment is stated on a per share basis — dividends per share (DPS).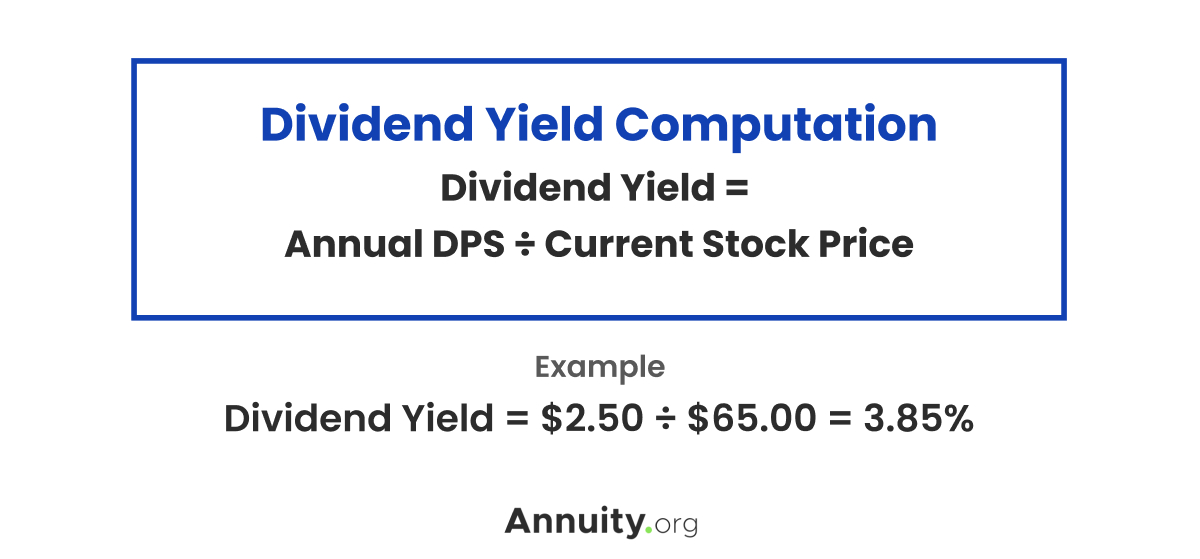 The example above reflects the dividend yield for a company that pays annual DPS of $2.50 and trades at a price of $65.00 per share.
Commercial Real Estate — Capitalization Rate
For commercial real estate investments, such as residential rental properties, storage units, parking lots and industrial facilities, the metric of focus is the capitalization rate. It is a measure of the net operating income generated by a property (rent revenue minus operating expenses) relative to its current market value. The ratio provides an estimate of the amount of income you can expect to receive each year for every dollar invested in the property.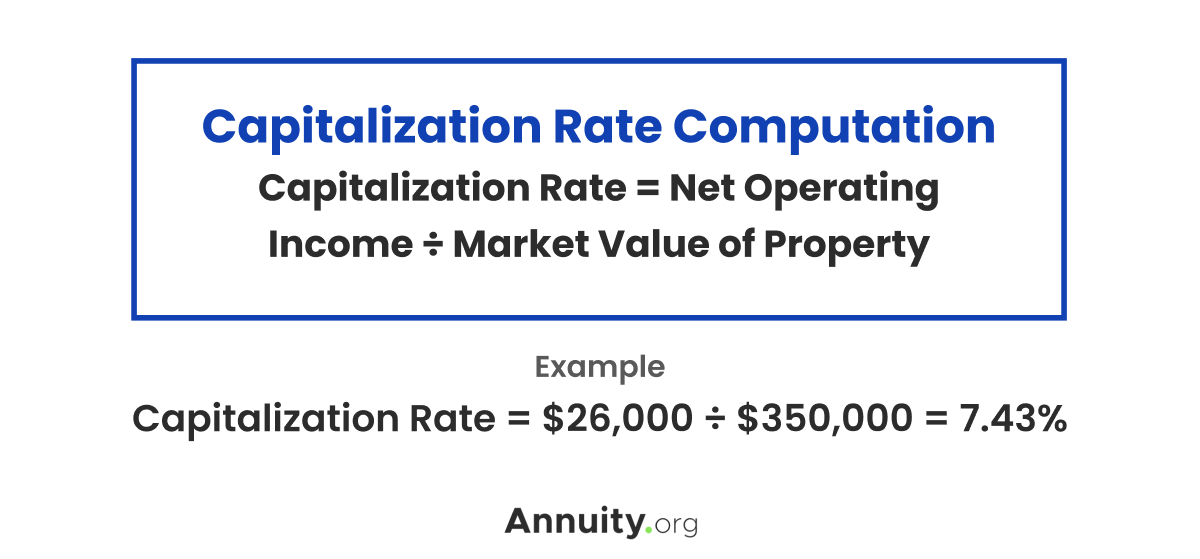 The example above reflects the capitalization rate for a $350,0000 vacation rental that generates $26,000 of net operating income.
Note:
Most people do not invest in distinct properties. Most people invest in commercial real estate via diversified, publicly traded real estate investment trusts (REITS). These securities trade on stock exchanges and distribute income just like stocks. As a result, for REITS, the optimal measure of income is the dividend yield.
The example above reflects the capitalization rate for a $350,0000 vacation rental that generates $26,000 of net operating income.
Note:
Most people do not invest in distinct properties. Most people invest in commercial real estate via diversified, publicly traded real estate investment trusts (REITS). These securities trade on stock exchanges and distribute income just like stocks. As a result, for REITS, the optimal measure of income is the dividend yield.