Balanced allocation value, or BAV, is a term used to describe a key measurement feature of some fixed index annuities. To understand BAV, you first need to know the basics of a fixed index annuity.
Fundamentals of a Fixed Index Annuity
A fixed index annuity is a contract issued by an insurance company to an individual looking to save money for retirement.
In exchange for an upfront premium payment, the insurance company provides the individual, or annuitant, the potential to grow their funds based on the performance of an underlying index, such as the Standard & Poor’s 500 Composite Stock Price Index (S&P 500).
At the same time, the annuity protects against losing your money and guarantees a minimum rate of return.
A fixed index annuity is structured to include:
- Accumulation period:
- The insurance company invests your upfront premium and your annuity earns interest.
- Payout period:
- You receive a steady stream of income from your annuity.
The accumulation period, which can often span 10 years, consists of a series of strategy terms. A strategy term is a specific period, expressed in years, that is used to measure earnings. Each term usually lasts for one to two years.
At the end of each term, the insurer measures the performance of the underlying index and calculates how much interest is credited to your annuity.
Each end-of-term measure, which is known as the accumulation value, becomes the floor for the next period-end performance measurement.
Once a new floor is established, the value of your annuity is locked in and cannot decline, even if the index performance worsens. However, the accumulation value will be reduced by any administrative charges and/or withdrawals.
Balance Allocation Value Explained
Some fixed index annuities go a step further, allowing the annuitant the option to manually lock into a value mid-term — usually once per term. If you go this route, the mid-term value overrides the beginning accumulation value and becomes the new floor for the next end-of-term measurement.
Locking in a value mid-term can be quite valuable, especially during times when the underlying index is highly volatile.
This is where the balanced allocation value comes into play. The BAV is a daily calculation of the potential interest available to the annuitant. BAV reflects any uncredited returns above the beginning accumulation value.
The BAV has the potential to increase with the specified underlying index, but it cannot fall below the current accumulation value.
BAV and Surrender Periods
A surrender period is a specified amount of time you must wait before you can withdraw money from your annuity without penalty. Generally, the BAV is not available if you withdraw from your annuity before the surrender period ends.
Your insurer may allow penalty-free withdrawals up to 10% during the surrender period, but the BAV cannot be included in the penalty-free withdrawals.
The balance allocation value feature can be a valuable option for introducing added protection at key times in volatile market environments. It is most valuable with underlying indices that are especially volatile. However, it is worth considering whether it is a feature that you will be able to use effectively. Depending on the annuity, this may be an optional add-on with a separate cost. In these cases, it is tempting to believe you can use it effectively to time the market and lock in a high accumulation value at just the right time, but this is harder than it looks. Be wary of attempting to play the market-timing game when the annuity itself is designed to help you avoid that already.
How soon are you retiring?
What is your goal for purchasing an annuity?
Select all that apply
Balance Allocation Value Example
Let’s look at how the BAV works, given the following simplified set of assumptions:
- On Jan. 1, 2015, you purchased a fixed index annuity for $100,000. The contract specifies a 10-year accumulation/surrender period.
- It is indexed to the S&P 500, allowing you to participate in 100% of upside performance, up to a maximum of 5% annually, and 0% of downside performance. Additionally, the contract guarantees a minimum rate of return of 2% annually for years two to 10.
- The contract specifies point-to-point valuation measurement and interest crediting once per year on January 1, along with an annual reset of the index.
- The contract also specifies a daily BAV and the allowance for one manual valuation per strategy term.
- Since the purchase of the annuity, you have not made any withdrawals or incurred any administrative charges.
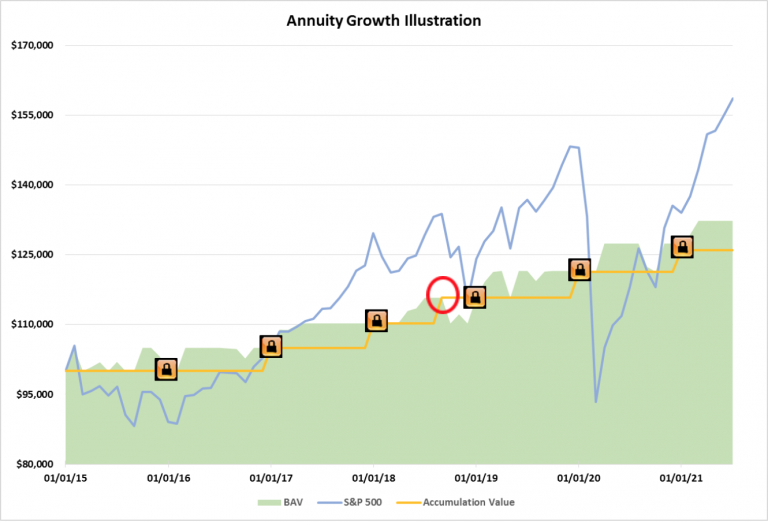
The performance of your annuity since purchase is illustrated below. The gold line indicates the accumulation value with “locked in” valuation measurements on each January 1. The daily BAV is presented via the green shading, and the performance of the reference index, the S&P 500, is displayed via the blue line.

As you can see, the accumulation value has increased at fairly consistent intervals with no volatility, while the S&P 500 has experienced a significant amount of volatility.
With regard to the BAV, the red circle is the focal point. It represents a manual, mid-term value lock exercised in early September 2018.
Essentially, you had the foresight to determine the S&P 500 had reached a high point, and you locked in the value, rather than waiting for the automatic valuation measurement on Jan. 1, 2019.
As a result, you were not impacted by the ensuing market downturn. Your manual lock put a floor on the accumulation value, facilitating a higher rate of growth.
Editor Sierra Campbell contributed to this article.


