Fixed index annuities (FIAs), also known as indexed annuities, are designed for people who want to grow their money based on market performance — without exposing their savings to market losses.
In today’s environment of higher interest rates and unpredictable markets, many pre-retirees and retirees are rethinking how much risk they’re willing to take. FIAs have gained attention because they aim to solve a familiar problem: how to pursue growth while protecting the money you’ve already worked to save.
Unlike variable annuities, FIAs do not decline in value when the market falls. Unlike traditional fixed annuities, they can provide higher growth potential by linking interest credits to a market index, such as the S&P 500.
Why Fixed Index Annuities Matter Right Now
For years, savers faced a tough choice. Conservative options often produced modest returns, while growth-oriented investments required accepting full market risk. That trade-off is even more uncomfortable in a world of rising rates and market volatility.
Higher interest rates enable insurers to offer more competitive index annuity terms, including improved caps and participation rates. At the same time, ongoing market swings increase the appeal of principal-protecting strategies. For people nearing retirement — or already relying on their savings — FIAs can offer a way to stay invested without jeopardizing their financial security.
Here’s why FIAs are especially relevant today:
- Higher interest rates have increased caps and participation potential on many index annuities
- Volatile markets have made downside protection more valuable than ever
- Retirement planning priorities have shifted toward income security and principal preservation
For people approaching or already in retirement, FIAs can offer a middle ground between growth and safety.

How Fixed Index Annuities Work
The mechanics of an indexed annuity are easier to understand when you think of it as a simple three-part process rather than a collection of technical features.
The 3-Step FIA Framework
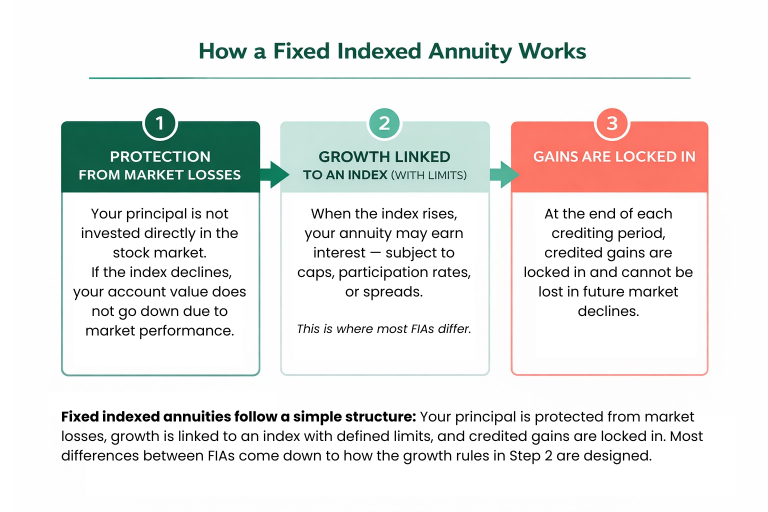
1. Protection First
Your principal is protected from market losses. If the index linked to your annuity declines, your account value does not go down due to market performance.
2. Growth With Limits
Your potential gains are linked to the performance of a market index, such as the S&P 500. However, gains are limited by rules like caps, participation rates or spreads.
3. Gains Lock In
At the end of each crediting period, any gains are locked in. Once credited, they cannot be lost due to future market declines.
Most meaningful differences among indexed annuities come down to how the middle step — the growth calculation — is structured.
Crediting Methods for Fixed Index Annuities
Fixed index annuities do not earn interest the same way as mutual funds or stocks. Instead, growth depends on a set of predefined rules that control how much of the index’s performance is credited to your account.
The three most common crediting methods are caps, participation rates and spreads.
Caps
A cap limits the maximum interest you can earn in a crediting period.
If the index exceeds the cap, your gain is limited to the cap. For example, a 5% cap means you receive a maximum return of 5%, even if your index sees a growth of 8%.
Participation Rates
A participation rate determines how much of the index’s gain is credited to your annuity.
For example, a 70% participation rate means you receive 70% of the index’s increase.
Spreads
A spread is a percentage subtracted from the index’s gain before interest is credited.
Higher spreads reduce the amount of credited interest, even in strong market years. For example, a 6% spread means a 9% gain would be reduced to a 3% return.
Each of these mechanisms affects the upside potential of your annuity. They also explain why FIA performance can vary significantly across products, even when they track the same index. These terms can change over time as interest rates and insurer pricing adjust, which is why ongoing review matters.
Indexing Methods for Fixed Index Annuities
While all indexed annuities protect your principal and lock in credited gains, where they differ is how they measure index performance before applying caps, participation rates, or spreads.
That measurement process is called the indexing method.
The most common indexing methods are annual reset, point-to-point, monthly averaging and high water mark.
- Annual Reset (Ratchet) Method
- Measures the index’s performance over a single year. At the end of the year, gains (if any) are credited and locked in. The index value then resets, and the next year starts fresh. If the index declines during the year, no interest is credited, but your account value does not decrease.
- Point-to-Point Method
- Compares the index value at the beginning and end of a crediting period. That period is often one year, but can be longer. Only the starting and ending values matter — the ups and downs in between are ignored.
- Monthly Averaging Method
- Measures the index by averaging its value over a series of monthly checkpoints, rather than relying only on the starting and ending values. Typically, the index value is recorded at the end of each month during a one-year period. Those 12 values are averaged together and compared to the starting index value to determine interest.
- High Water Mark Method
- Tracks the highest index value reached during a multi-year period. Instead of focusing only on the ending value, it credits interest based on the peak value achieved during the term.
What Fixed Index Annuities Look Like in Real Markets
Understanding how FIAs respond to different market environments clarifies their role within a broader strategy.
If the Market Declines
Your account value does not decrease due to market losses. You earn zero interest for that period, but your principal remains intact.
If the Market Grows Moderately
You earn interest based on the index’s gain. Credited interest depends on caps, participation rates or spreads.
If the Market Grows Strongly
You may earn the maximum allowed under your annuity’s rules. Excess market gains above caps are not credited.
This pattern — limited downside with limited upside — defines the FIA trade-off.
Who Fixed Index Annuities Tend To Be Right For
Indexed annuities are most often used by people who value predictability and protection more than maximum growth. They can be appealing for those approaching retirement who want to stay connected to market performance but feel uneasy about sharp downturns.
They may be less suitable for investors who want full exposure to market gains, need frequent access to their money or prefer straightforward products without surrender periods or changing crediting terms. Recognizing these boundaries is just as important as understanding the benefits.
FIAs May Be a Good Fit If You:
- Want protection from market losses
- Are concerned about volatility as you approach or enter retirement
- Want tax-deferred growth beyond traditional retirement accounts
- Prefer steady, rules-based growth over full market exposure
FIAs May Not Be Ideal If You:
- Want full participation in market gains without limits
- Need frequent or short-term access to your money
- Prefer investments without surrender periods
- Are comfortable with market risk in exchange for higher upside potential
If you are thinking about buying a fixed index annuity, make sure you understand how growth is credited to your account. You may have a minimum guaranteed return, but your upside will be capped, as well.
Brandon Renfro, Ph.D., CFP®, RICP®, EACo-Owner of Belonging Wealth ManagementAs a Certified Financial Planner™ professional and Retired Income Certified Professional®, Brandon Renfro is well-versed in the financial information and strategies needed to meet retirement goals. In addition to co-owning Belonging Wealth Management and assisting clients, Brandon writes regularly for financial publications.

Fixed Index Annuities vs. Other Annuity Types
Fixed index annuities sit between traditional fixed annuities and market-based annuities.
| Annuity Type | Growth Potential | Downside Protection | Market Exposure |
|---|---|---|---|
| Fixed | Low to moderate | Full protection | None |
| Fixed Index | Moderate, with limits | Protection from market losses | Indirect (index-linked) |
| Variable | High, market-driven | No protection | Direct |
Each annuity type reflects a different approach to balancing growth and risk. Indexed annuities are often chosen by people who want to stay connected to market performance while prioritizing protection as they approach or enter retirement.
The “right” option depends less on the product itself and more on how much risk you’re willing to accept — and what role the annuity plays in your overall retirement strategy.

Find Out How Much Growth You Could Lock In
Using Fixed Index Annuities for Retirement Income
In addition to accumulation, many fixed index annuities can support retirement income planning through optional income riders. These riders can provide guaranteed lifetime income, regardless of how the linked index performs.
For retirees, this can help supplement Social Security or pensions and reduce concerns about outliving their savings. While income riders add cost and complexity, they are often a primary reason people choose an FIA.
A Real-World Example: How an FIA Can Support Retirement Income
Numbers and technical terms explain how fixed index annuities work. But seeing one in a real-life situation makes the value much clearer.
Meet Hellen.
Hellen is 65 and recently retired. She has $100,000 she wants to put to work to help supplement her Social Security income. Like many retirees, she’s caught in the middle — she doesn’t want to risk market losses, but she also doesn’t want her money sitting in a low-yield option like a certificate of deposit.
Hellen chooses a fixed index annuity because it offers a balance she’s comfortable with.
When Hellen’s selected index performs well, her annuity credits interest. When the market has a down year, her account value remains unchanged rather than dropping. The result is a low-stress way to grow savings and add predictable income to her retirement plan.
For Hellen, the real benefit isn’t chasing the highest return — it’s knowing her money can work for her without putting her retirement security at risk.
- Historical Data.
- Expert Analysis.
- Instant Download.
The Role of Interest Rates in FIA Performance
Interest rates influence nearly every aspect of an indexed annuity. When rates are higher, insurers typically have greater flexibility and can offer more attractive caps or participation rates, thereby improving growth potential. If rates decline, future crediting terms may become less favorable — but gains already credited remain protected.
This dynamic is one reason many consumers closely monitor the timing of an FIA purchase and the contract’s long-term structure.
Pros and Cons of Fixed Index Annuities
Like any financial product, fixed index annuities involve trade-offs. They offer protection from market losses and the potential for tax-deferred growth, but they also limit upside and often include surrender charges for early withdrawals.
Advantages
- Protection from market losses
- Potential for market-linked growth
- Tax-deferred accumulation
- Optional guaranteed income features
Drawbacks
- Limited upside compared to direct market investments
- Surrender charges for early withdrawals
- Complex rules that require careful understanding
A full evaluation of benefits and drawbacks helps determine whether an FIA aligns with your goals.
Choosing the Right Fixed Index Annuity
No single fixed index annuity is best for everyone. The right choice depends on your goals, your tolerance for complexity, your income needs and the current interest-rate environment.
Comparing products carefully — and understanding how their rules work in practice — is far more important than chasing the highest advertised rate.
Indexed annuities are designed for individuals seeking growth potential without market losses, especially during periods of economic uncertainty.
By combining principal protection, rules-based growth and optional income features, FIAs can play a valuable role in a diversified retirement strategy — when used appropriately.
Understanding how they work, when they make sense and what trade-offs they involve is the first step toward making an informed decision.